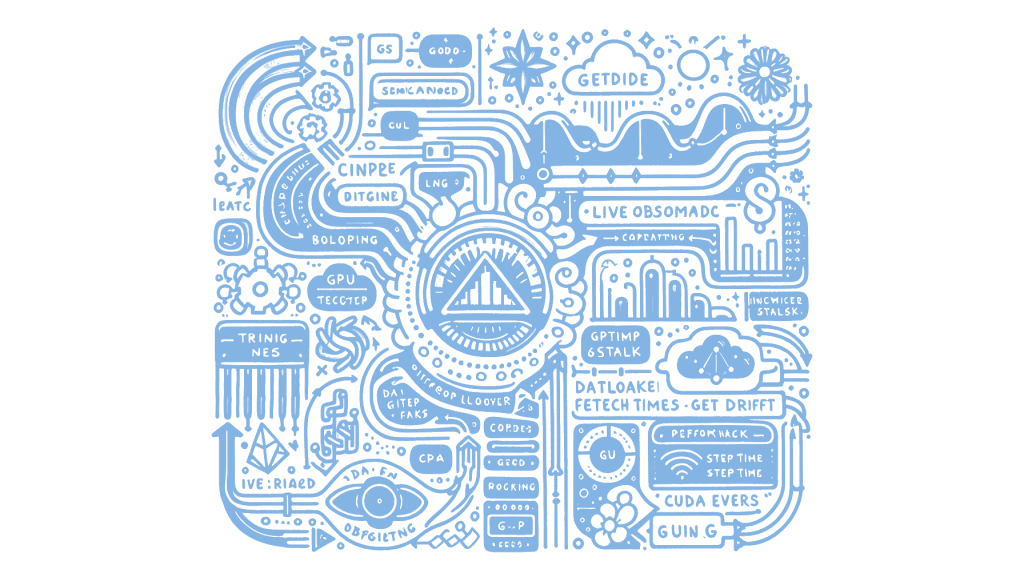
TraceML has been updated to enhance real-time observability during PyTorch training, particularly for long or remote runs. Key improvements include live monitoring of dataloader fetch times to identify input pipeline stalls, tracking GPU step time drift using non-blocking CUDA events, and monitoring CUDA memory to detect leaks before out-of-memory errors occur. Optional layer-wise timing and memory tracking are available for deeper debugging, and the tool is designed to complement existing profilers. Currently tested on single-GPU setups, with plans for multi-GPU support, TraceML aims to address common issues like step drift and memory creep across various training pipelines. Feedback is sought from users to refine signal detection. This matters because it helps optimize machine learning training processes by identifying and addressing runtime issues early.
Real-time observability in machine learning training, particularly with PyTorch, is crucial for optimizing performance and resource management. TraceML’s recent advancements aim to address the challenges faced during long or remote training runs by making runtime issues visible while jobs are still in progress. This is particularly important for practitioners who need to identify and resolve issues such as input pipeline stalls, GPU step time drift, and CUDA memory leaks, which can significantly impact the efficiency and success of training models.
One of the key features of TraceML is its ability to track live dataloader fetch times. This is essential for catching silent input pipeline stalls that can slow down training without obvious signs. Additionally, GPU step time drift is monitored using non-blocking CUDA events, allowing for a more nuanced understanding of performance issues without the need for global synchronization. By keeping an eye on CUDA memory usage, TraceML helps in spotting gradual memory leaks before they lead to out-of-memory (OOM) errors, which are common pitfalls in intensive training sessions.
For deeper debugging, TraceML offers optional layerwise timing and memory tracking, though these features are off by default to avoid unnecessary overhead. This functionality is particularly useful for developers who need to dive deep into specific layers of their models to pinpoint bottlenecks or inefficiencies. The tool is designed to be model-agnostic, making it versatile across different types of PyTorch models, though it has been primarily tested on large language model (LLM) fine-tuning tasks. This broad applicability ensures that the insights gained from TraceML can benefit a wide range of machine learning projects.
Currently, TraceML supports single-GPU setups, with plans to expand to multi-GPU and distributed environments. This expansion is crucial as many modern machine learning tasks require distributed computing to handle large datasets and complex models. Feedback from users running training jobs is highly valued, as it can guide further development and help identify any missing or noisy signals. By enhancing real-time observability, TraceML not only complements existing profilers but also empowers developers to optimize their training processes, ultimately leading to more efficient and effective machine learning models.
Read the original article here


Comments
2 responses to “Enhancing PyTorch Training with TraceML”
The integration of TraceML for real-time observability in PyTorch training seems like a significant step forward, particularly with its ability to monitor dataloader fetch times and GPU step time drift. These features promise to enhance the debugging process and optimize training efficiency. Given the current focus on single-GPU setups, what challenges do you anticipate when scaling TraceML for multi-GPU environments?
Scaling TraceML for multi-GPU environments could present challenges such as ensuring synchronization across multiple devices and managing increased data flow. Additionally, optimizing memory usage and maintaining low overhead will be crucial to avoid performance bottlenecks. For more detailed insights, consider reaching out to the original authors through the article linked in the post.